

Can the Fed take a wait-and-see approach to inflation?
Higher shelter costs are complicating the Fed’s next move
5 min read
KEY POINTS
- Headline and core CPI both came in hotter than expected, signaling that inflation remains more persistent than markets anticipated.
- Shelter costs, which make up roughly one-third of core CPI, are proving to be sticky as rising home values and rebounding real-time rents slow the disinflation trend.
- While stronger inflation data initially boosted expectations of additional Fed tightening, concerns about slowing growth ultimately outweighed inflation fears in bond markets.
Recent inflation data confirmed that price pressures remain from both the perspectives of the Consumer Price Index (CPI) and the Producer Price Index (PPI). However, our chart this week focuses just on CPI, where inflation came in hotter than expected at both the headline and core levels.
We were all expecting headline inflation to move higher, as energy prices continue to be elevated and pressures in oil distillates—like gasoline, jet fuel and especially diesel—result in higher prices for consumers and businesses alike.
The bigger surprise in the CPI data was the core rate being unexpectedly higher. A key part of the declining trend in core inflation has been moderating shelter costs. In fact, within the core measures of CPI, shelter makes up roughly one-third of the price index. A major part of this measure is a survey question to consumers on “owners’ equivalent rent,” which is determined by homeowners being the price for which they would rent their home. Obviously, this method of measurement is impacted by any number of factors, but home values are key amongst them. In short, as home values increase, the imputed rent homeowners might expect tend to move higher. Conversely, declining home value might lead to lower expected rents. Since this is a survey question and most consumers don’t value their homes monthly, changes in the absolute levels and the direction of those changes tend to happen slowly and lag what might be happening in the open market.
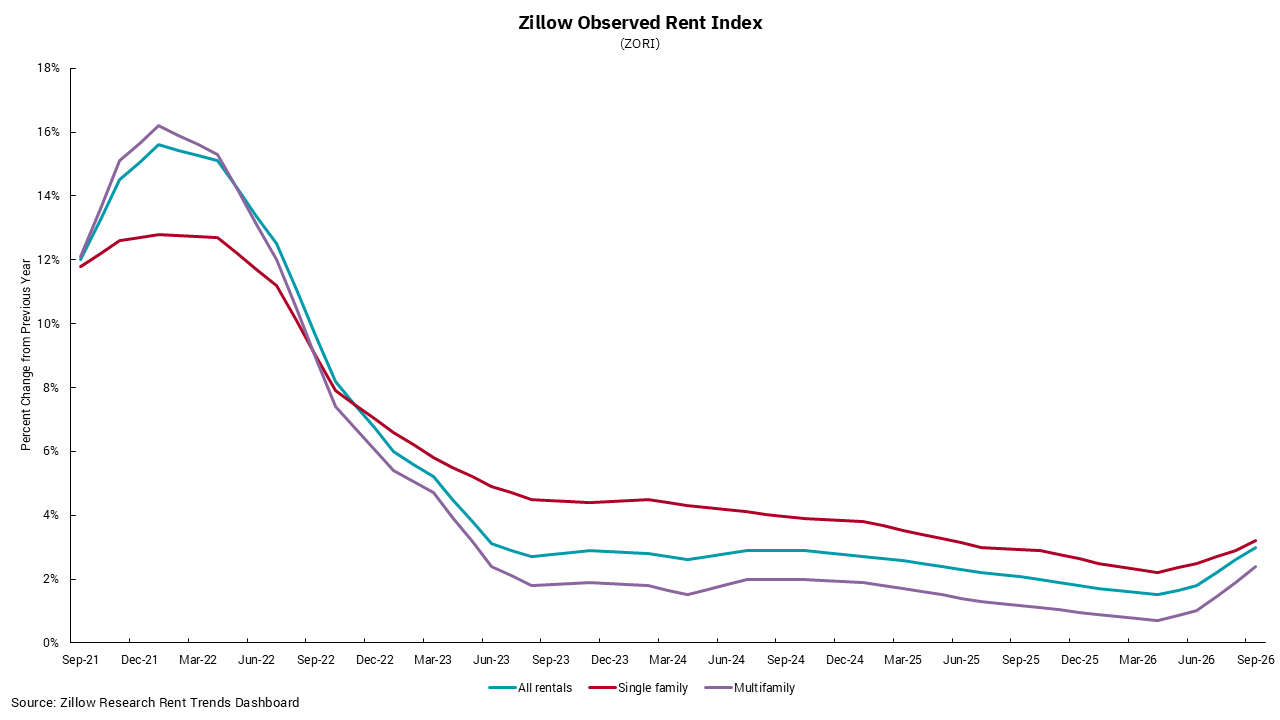
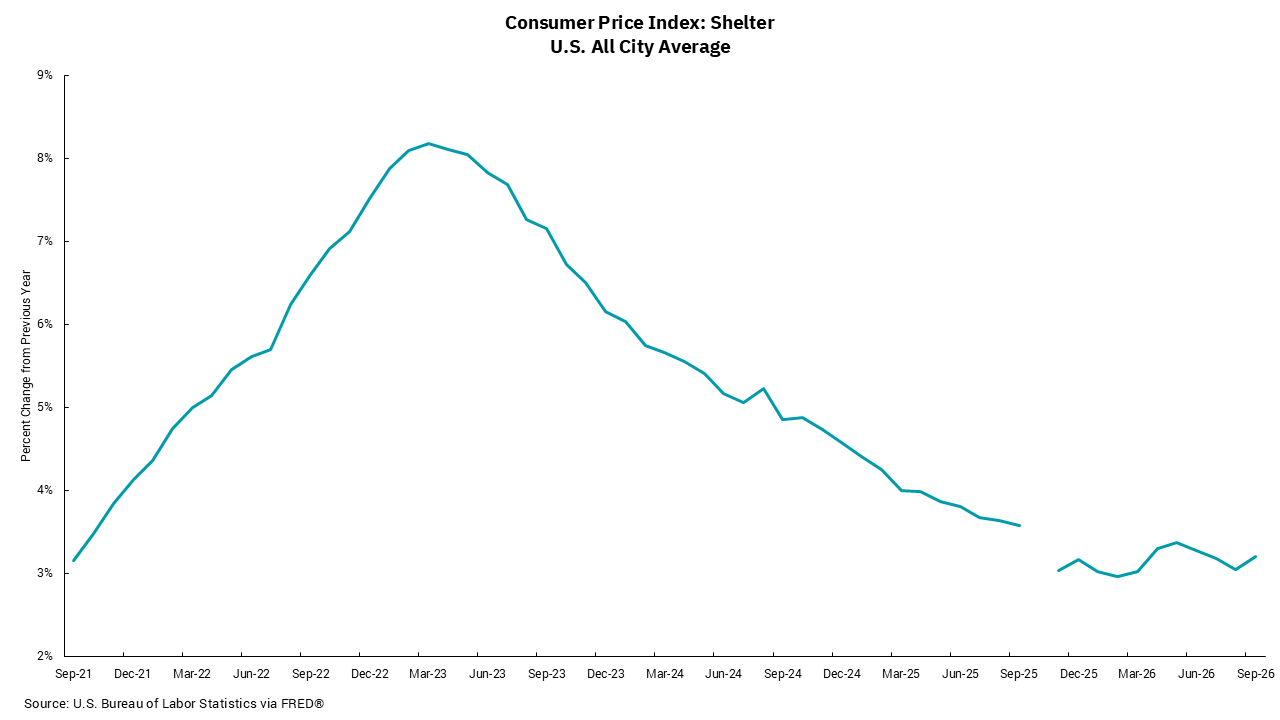
One way to see this is to look at private indexes like the Zillow Observed Rent Index, shown in the top chart. You can see that actual rents moved up further and faster than the shelter component of CPI and also reversed lower faster and sooner. This is important, as one of the reasons why the Fed had believed that core inflation would continue to moderate is that trends in the shelter component were moving lower. Lower real-time rents, along with moderating home price appreciation, could indicate the trend continues. However, in the last couple of months, there has been a shift in real-time rents, which is prompting the overall trend of inflation to be reassessed, along with whether the Fed can “wait” to see more inflation data. After the release of the most recent CPI data, rates moved higher and the chances of a Fed rate increase in October rose.
This all put the market on notice as the PPI data came out Thursday. It was another hot release, and one could have reasonably expected rates to move even higher and chances of a Fed move to increase again. Instead, rates were lower, as concerns about growth, particularly within the artificial intelligence (AI) ecosphere, overshadowed increasing price pressures. We will explore the relationship between inflation, growth and bond yields in our next release.
Get By the Numbers delivered to your inbox.
Subscribe (Opens in a new tab)